Last year, we examined the impact of the then-emerging COVID-19 pandemic on e-commerce in a multi-part series using aggregate global marketplaces gross merchandise value (GMV) data from our platform. To summarise last year, we began the year with normal year-over-year e-commerce growth rates until mass shutdowns started mid-March. Over the next several weeks, growth in categories such as health and beauty began to explode while other more discretionary categories languished (who can forget the Great Toilet Paper Run of 2020). We saw a particularly meaningful spike in GMV around the time of the April stimulus in the United States for nearly every category, and e-commerce levels remained well above prior levels for the remainder of 2020.
With the latest stimulus payments in the US beginning last week, we thought it would be useful to compare March and April in both 2020 and 2021 to see the impact of the stimulus payments in both periods and the year-over-year e-commerce growth in certain categories.
Before digging into the data, please note the following points:
- This data is based on marketplaces GMV aggregated across our entire customer base globally and compares Mar 1 – Apr 30, 2020 against Mar 1 – Mar 22, 2021.
- The data presented below highlights a subset of marketplace categories. Because marketplaces have different category structures, the data is presented using categories that have been standardised by Rithum.
- This data is not a proxy for overall e-commerce activity or the performance of any individual business, including Rithum or any individual marketplace.
- The data shown below is based on a year-over-year comparison of trailing 7-day GMV and is expressed as percentage growth, but with actual numbers removed. The Y-axis scale is different on each graph.
- All calculations are done in USD. Global currencies are converted to USD using the conversion rate on the day of the order. These results are not normalised to account for fluctuating exchange rates. Please note that volatility in various currencies may slightly impact these trends.
Comparing 2021 (so far) to 2020, we see two main themes:
- E-commerce remains strong across most categories – Data from the U.S. Census Bureau shows the great leap forward for e-commerce in retail sales. However, though we’re getting closer, the world isn’t quite back to normal yet. And, surveys suggest that consumers will retain new habits and expect to shop online more than before the pandemic.
- Math – Even though consumers continue to rely heavily on e-commerce, the leap in online shopping in 2020 was significant, and at this point we don’t anticipate the same step-function increase in volume going forward as we saw last year, although we also don’t expect volumes to revert to pre-pandemic levels either. Growth rates are high so far in 2021 for categories that underperformed this time last year and have come back down to earth for categories that were outperforming in March 2020.
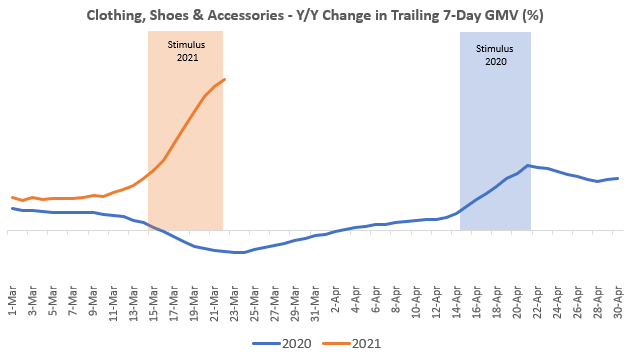
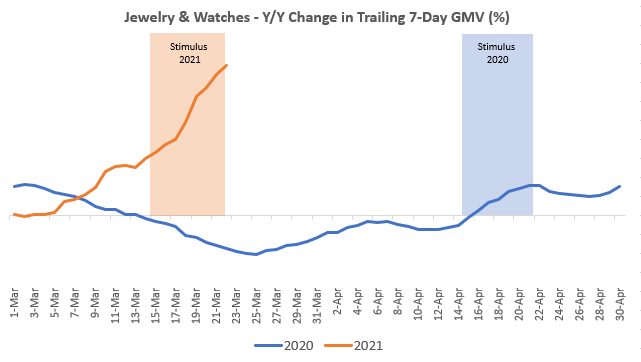
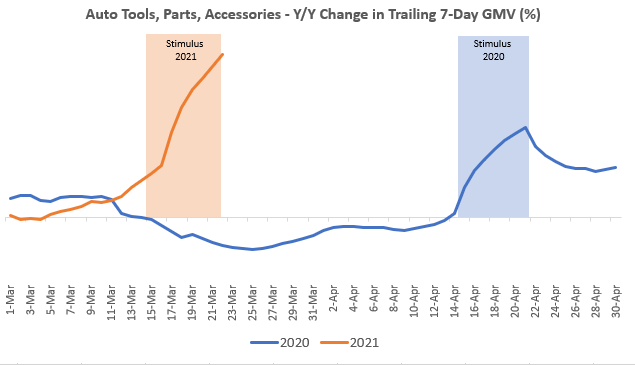
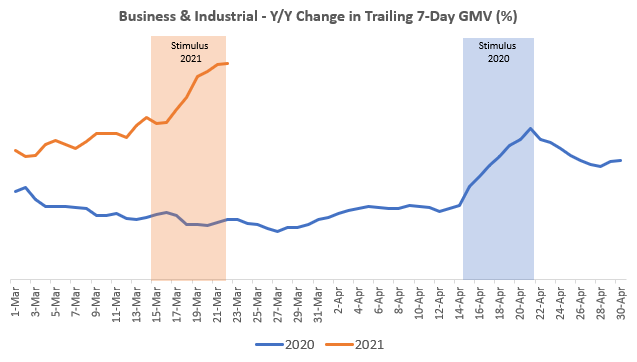
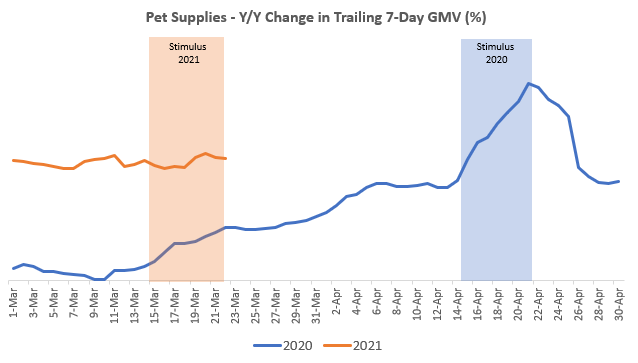
As we look at e-commerce growth by category, there are three distinct groups, as noted below. In the charts below, the light orange rectangle represents approximate timing of the 2021 stimulus payments and the light blue rectangle represents approximate timing of the initial 2020 stimulus payments.
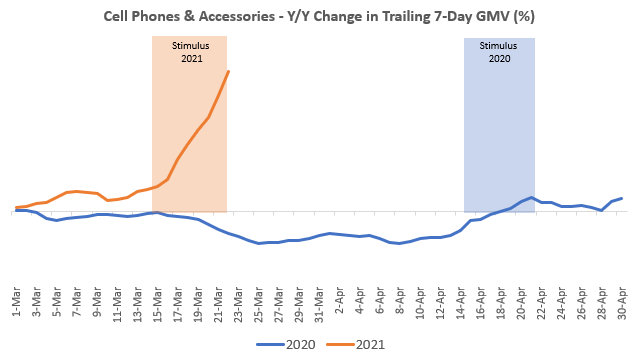
Categories Initially Slowed by COVID but Booming (Initially) From the 2021 Stimulus
Once the impact of COVID became widespread in March 2020, growth rates declined in certain discretionary categories, including clothing, shoes, and accessories; jewellery and watches; mobile phones and accessories; and auto tools, parts, and accessories. As these categories are related to being out of the house and on the move, even the ones that benefited from the April 2020 stimulus did so much less than categories that included items needed to shelter at home. However, in March 2021, our data show these categories significantly benefiting from this year’s stimulus both due to stronger demand and the initial lull last year.
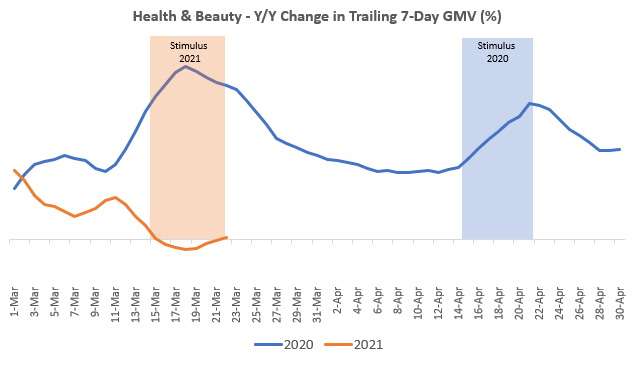
Categories that Grew Quickly Due to COVID in March 2020
In 2020, the ‘health and beauty’ category was one of the earliest to see year-over-year e-commerce growth increase significantly as consumers stocked up on hand washes, over-the-counter medications, and vitamins/herbs starting in late February. While online sales in this category have remained robust, it has now lapped the initial period of explosive growth from 2020. Thus, we see the impact on the year-over-year growth rates in 2021 (math!).
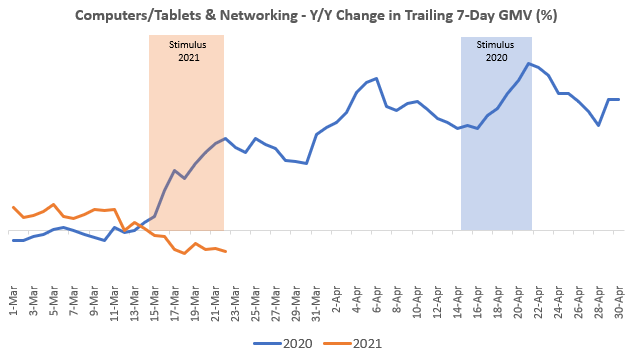
Computers/tablets and networking was another category that started to grow rapidly in early March 2020 as consumers began preparing to work and school from home. Again, we can see that the growth rates in 2021 have fallen due to the difficult comparisons to the high growth rates in 2020, as well as well-documented supply chain constraints affecting many industries and categories. As these items typically have useful lives measured in years, we may also be seeing some impact of demand being pulled forward in 2020.
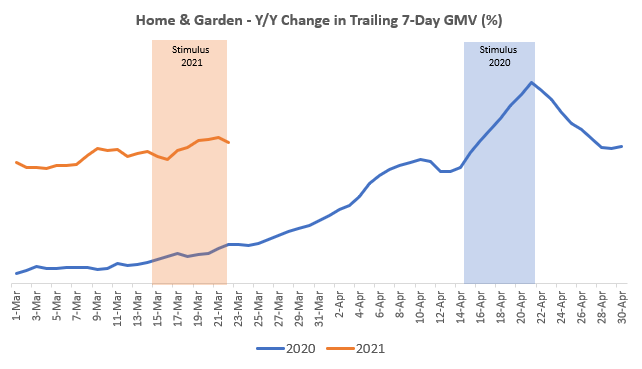
Categories that Grew During COVID and are Still Going Strong
Finally, there are other categories that grew significantly during COVID and over the course of 2020 and are still growing at robust rates. The home and garden category, for example, is broad and demand within that category has shifted over time. During the early days of the shutdown, we saw tremendous growth in items such as toilet paper, cleaning supplies and home office furniture. Over time, subcategories related to home improvement strengthened.
Business and industrial and pet supplies are other categories in which growth remains well above the 2020 rates. As we lap the peaks from 2020 in the coming weeks and months, it’s possible that the year-over-year growth rates in these categories may soften even with sustained levels of e-commerce activity.
Conclusion
E-commerce penetration increased in 2020 by at least two to three years relative to the steady pace of growth we had seen in the years prior to 2020. Survey results lead us to believe that new online habits will stick and e-commerce will remain strong. Current e-commerce growth rates within specific categories reflect current demand, what was happening last year at this time, and the timing of stimulus payments. As we lap peak growth periods from 2020, growth rates in 2021 may be slower compared to the huge spikes we saw in 2020, which is to be expected.